Chart Tools by Google Code
“A picture is worth a thousand words.” To explain a set of data, the better way is create a chart. In PHP there a lot of chart designing tools/application. Today I spent some time with a charting tool provided by Google Code. I find this tool is really useful and easy to use. Like other Google codes it provides a lots of customization options. There are 2 kind of charting type supported by 2 different APIs. One produces Image chart and another produces Interactive Charts.
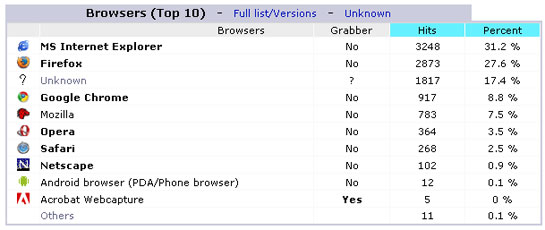
To explore with Google Chart API for Image chart I chose the data set of browser usages by visitors on my blog for the month of January 2011. Here is a snapshot from Awstats from my blog cPanel.
Here is the chart produced by the Google Chart API.
Comparison Chart produced by Google Chart
Let me explain the process I have used for drawing this chart. Continue reading ‘Chart Tools by Google Code’ »


