Chart Tools by Google Code
“A picture is worth a thousand words.” To explain a set of data, the better way is create a chart. In PHP there a lot of chart designing tools/application. Today I spent some time with a charting tool provided by Google Code. I find this tool is really useful and easy to use. Like other Google codes it provides a lots of customization options. There are 2 kind of charting type supported by 2 different APIs. One produces Image chart and another produces Interactive Charts.
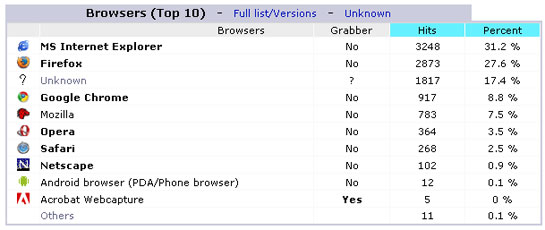
To explore with Google Chart API for Image chart I chose the data set of browser usages by visitors on my blog for the month of January 2011. Here is a snapshot from Awstats from my blog cPanel.
Here is the chart produced by the Google Chart API.
Comparison Chart produced by Google Chart
Let me explain the process I have used for drawing this chart. If you send a request URL with parameters in GET or POST then The Google Chart API returns a chart image as response. The request URL is https://chart.googleapis.com/chart. Here I have used GET method to send the parameters. Here is my URL for drawing this chart
https://chart.googleapis.com/chart?chs=560x270&cht=p3&chd=t:31.2,27.6,17.4,8.8,7.5,3.5,2.5,0.9,0.1&chdl=Internet%20Explorer%20%3A%2031.2%25|Firefox%20%3A%2027.6%25|Unknown%20%3A%2017.4%25|Google%20Chrome%20%3A%208.8%25|Mozilla%20%3A%207.5%25|Safari%20%3A%202.5%25|Netscape%20%3A%200.9%25|Android%200.1%25&chco=2855F0EE|FE8019EE|999999EE|FFE814EE|D20202EE|DE8074EE|5CA4D4EE|585991EE|00FF00EE&chtt=Browser%20Usage%20Comparison%20January%202011&&chts=32446D,16&chf=bg,s,FAF0FF
Here are the list of parameters with brief description :-
chs
This is the dimension for the chart. The syntax is chs=<width>x<height>. For both width & height max value is 1000 pixcels. However widthxheight should not exceed more than 300000.
cht
The chart type. The syntax is cht=<chart_type>. I have used p3(for 3D pie chart). You can use values like p(pie chart), lc(line chart), v(venn chart), s(scatter chart), bhs/bvs(bar chart) etc. Check the chart gallery for complete listing of available chart types.
chd
The data set for drawing the chart Basic syntax is chd=t:n1,n2,n3,n4…. n1, n2, n3 are floating point numbers with a value range of 0 – 100. Numbers below zero will be dropped and above 100 will be truncated to 100.
chdl
This is the chart legend text/label for each data/data series. The syntax is chdl=<data_1_label>|…|<data_n_label>. If you have multiple words as label then they must be used in encoded format(URL encoding).
chco
The color specification for each elements/series. Syntax for this parameter is chco=element_1_color|element_2_color|…|element_n_color. The color code is a string of RRGGBB format hexadecimal number format. With this each 6 character color code you can use optional 2 character hexadecimal number from 00 to AA. Hence the color code format used here is RRGGBB[AA]. The last AA is used as transparency value , where 00 means complete transparent and FF means complete opaque.
chtt
This parameter is for chart title. Syntax is chtt=<chart_title>. To provide a line break you can use “|“. However the chart title also should be in encoded format.
chts
This is used to mention the font size and the color of the chart title. Syntax is chts=<color>,<font_size>. Color is as RRGGBB format hexadecimal format and font size is in point value.
chf
This parameter is used for background fill. Syntax is chf=<fill_type>,s,<color>. Here I have used bg as fill_type which means background fill. s means solid color. Color code is in RRGGBB hexadecimal format.
Beyond these parameters there are more which can be used to draw charts as per requirement. You can draw more complex charts using this API. You can read Google Chart Tools. To use this chart API you don’t require any API key from Google. Currently there is no limit to the number of requests per day you can make to the Google Chart API, but Google have reserved the right to block any use that they regard as abusive.
There is Image Chart Editor which you can use to draw your chart. So happy charting then. 🙂


